Strange Attractors: The De Jong Attractors
Articles —> Strange Attractors: The De Jong Attractors

Strange Attractors are mathematical systems that tend to evolve over time. Attractors are represented by coordinates in space, each coordinate dependent upon the previous coordinate, the change between the two coordinates based upon one mathematical equation per dimension.
Given their properties, Strange Attractors can be quite artistic in nature. For instance, the Lorenz Attractor holds its own beauty of symmetry. The De Jong attractors are another system that, when visualized in two or three dimensions can be incredibly beautiful. The equations underlying the De Jong attractor follow:
xt+1 = sin(a * yt) - cos(b * xt)
yt+1 = sin(c * xt) - cos(d * yt)
Iterative calculation of the coordinates yields a set of coordinates which can be plotted in two dimensions. Values of the constants a, b, c, and d can be altered to generate different patterns from the attractor. Examples of the behavior of the attractor using different constants - in which each coordinate generated by the attractor are plotted as a cyan pixel (in total there are half a million iterations/coordinates) - are shown below:
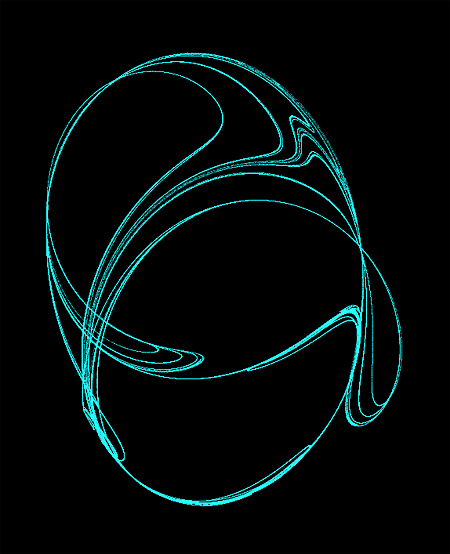
a = -2.24, b = 0.43, c = -0.65, d = -2.43
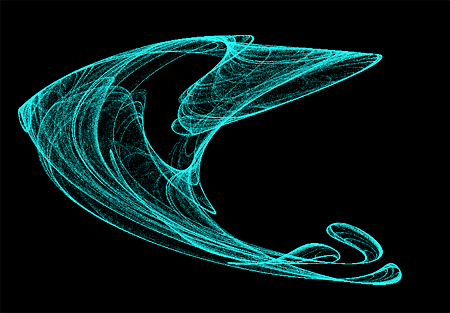
a = 2.01, b = -2.53, c = 1.61, d = -0.33
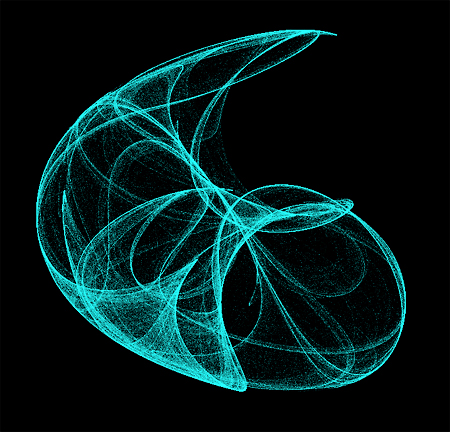
a = -2, b = -2, c = -1.2, d = 2
One can also make use of color algorithms to customize the rendering of each pixel. For instance, the following equations color each coordinate, resulting in the image below:
ip=1/(2*Math.PI);
v = sqrt((x-x12+(y-y12)*atan2(y1,x1)*ip
redt+1=(redt+abs(sin(v*PI*3.2-PI*.2)))*.5
greent+1=(greent + abs(sin(v*PI*12.3+PI*1.5)*.5+.5))*.5
bluet+1=(bluet + sin(v*PI*3.84+PI/2-.6)*.5+.5)*.5

Rainbow colored De Jong Attractor
Another method to render the attractor is through animation, although this requires a bit more art in figuring out how one wishes to alter the visualization of the attractor with the added dimension (time). The following is a video doing just this. Splines (Bezier Curves) were generated from the coordinates, and twenty random locations along the curve chosen. The locations were incremented for each frame, and rendered as spheres (head) and lines (tail). All images were created using Java and OpenGL (JOGL) and stitched together into a video using ffmpeg.
Animation of the DeJong Attractor. Music provided by Kevin MacLeod (Relent, Composed by Strauss) under the Creative Commons License (no changes were made to the audio).
Links
There are no comments on this article.